State of in-app
subscriptions in
the US 2023

The most comprehensive and representative report featuring the latest benchmarks on iOS subscription LTV, retention, renewals, refund rates, price changes, and the best performing paywalls.

03 12 v2 2 64cba87663b6c

Get the free report now

Take a sneak peek

slider1 64cba8adeb91b
slider2 1 64cba8cc54ef0
slider3 64cba8eb5e2e7
GET REPORT GET REPORT

What you’ll find in the report

Frame 427319943 min 1

25 Unique charts

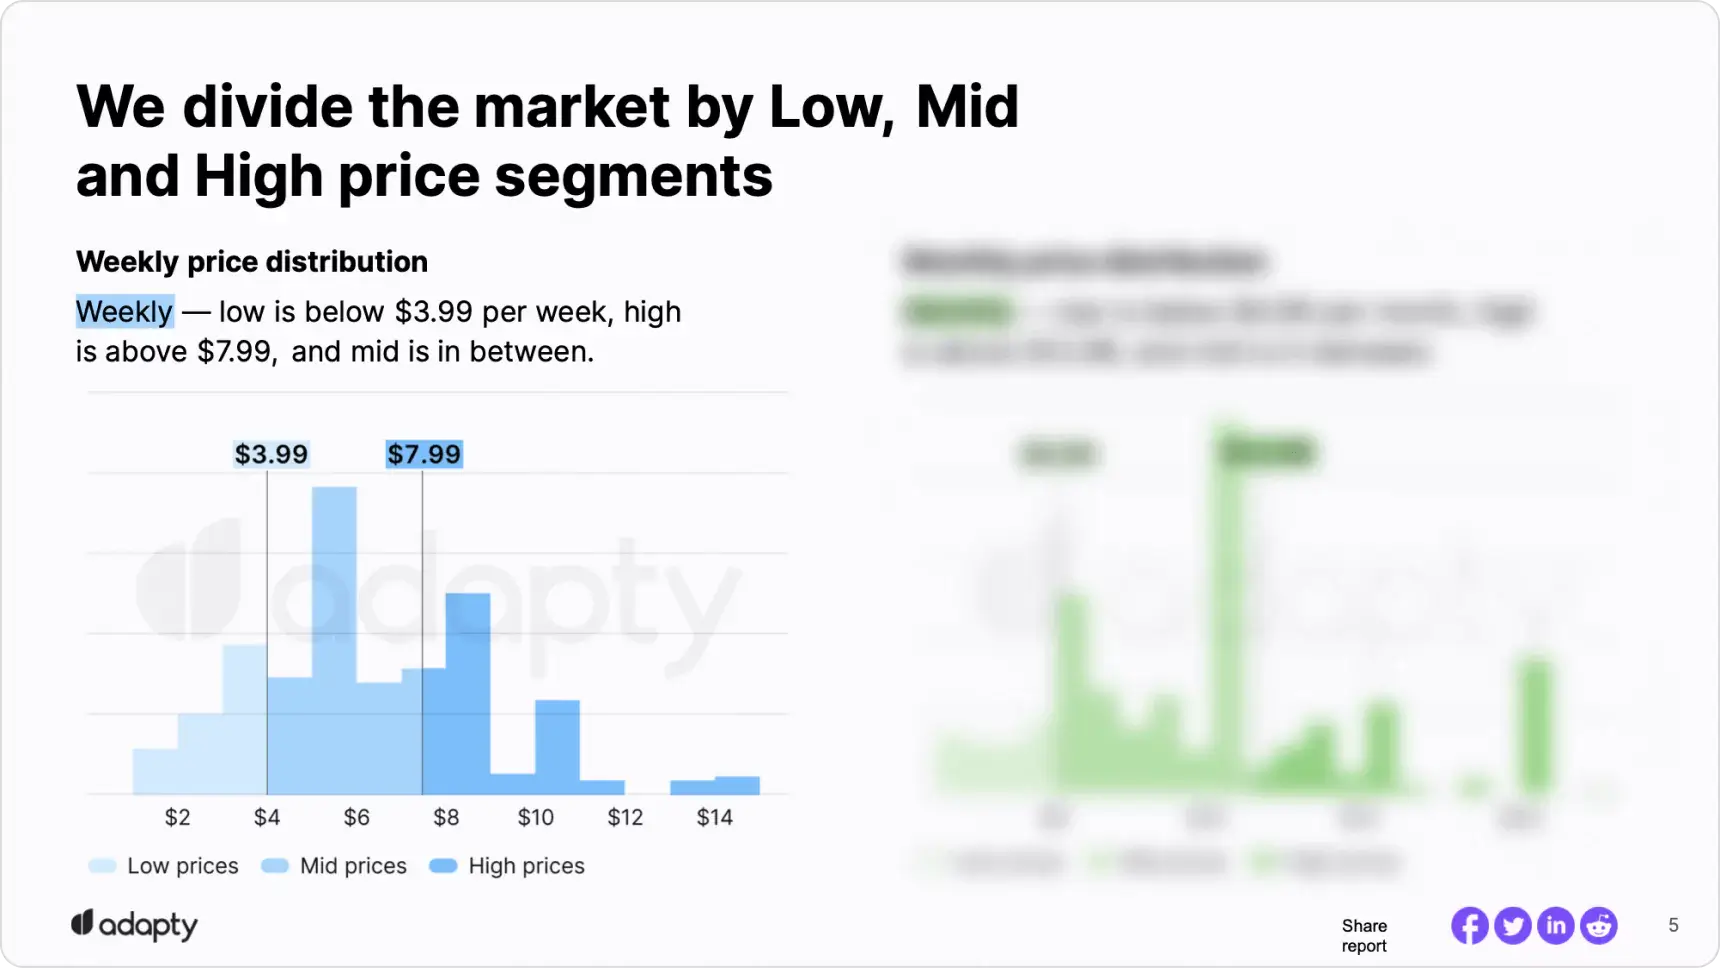
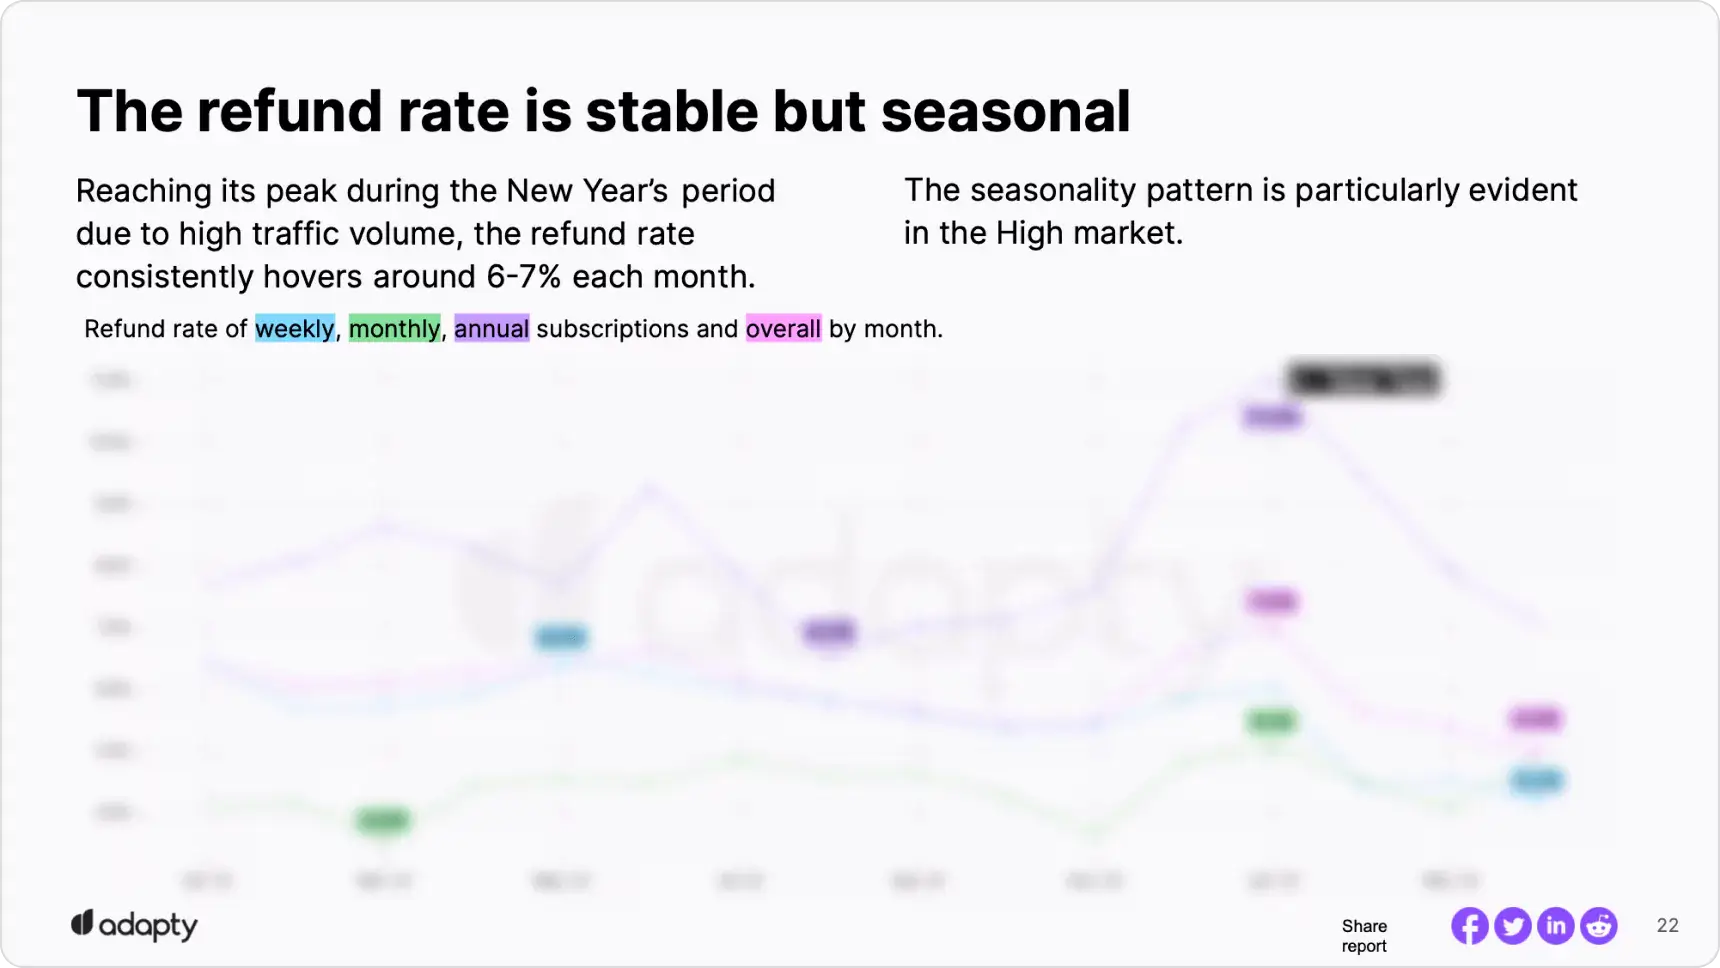
Look into neatly visualized charts on different aspects of the US subscription market, including price and product segmentations, retention, LTV, and many more.

ic sharp insights min 1

Insights based on
2023 data trends

No need to look way too deep: all the important findings from researching tons of information are highlighted and presented in a convenient format – just learn and apply them to your own project.

overview icon

Benchmarks for your
app economy

“Which subscription type is more profitable? How many products should I place on the paywall? When is the best time to raise prices?” – Find answers to all these questions and adjust your financial strategy.

Frame 427319938 min 1

30М

Transactions

icon 801 min 1

6.5М

Users

icon 80 min 1

13K

Paywalls

Expert opinion on the state of in-app subscriptions in 2023

“One of the secrets behind a profitable subscription business lies in finding the balance between offering the right types of products on the paywall, knowing how many products to offer, and how to price them.

This state of in-app subscriptions report provides insights and benchmarks for the US market you must be aware of in order to grow and prosper in the ever-shifting mobile app market”.

Frame 427319836

Vitaly Davydov

CEO at Adapty

GET REPORT

FAQ

Our research is primarily intended for app developers and publishers who are willing to find the best app growth strategy and be aware of the current situation in the US mobile subscription market.

Simply fill in the short form at the top of the page, and we’ll send you the report link to your email.

For this report, we’ve analyzed data from 6.5M users, 30M transactions, and 13k paywalls. We used the data only tracked by Adapty. The data were analyzed with respect to the apps and developers’ privacy. We processed the data in batches and added a bit of randomness to our results.

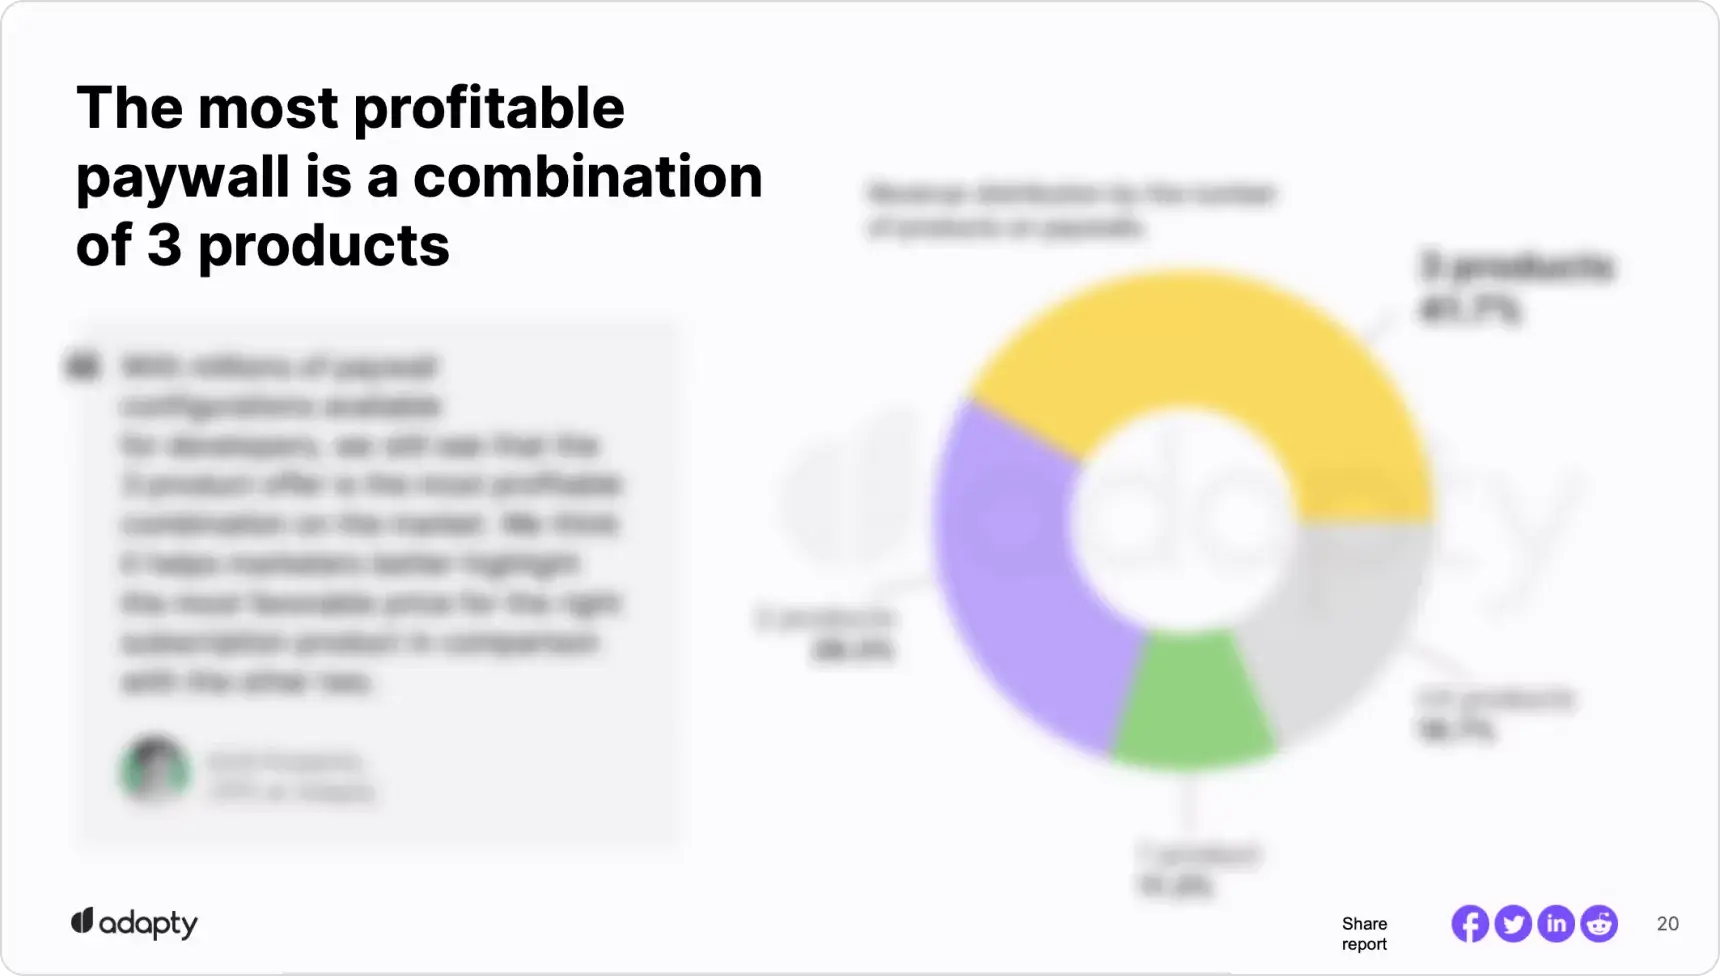
The report gives a thorough overview of the US subscription market, providing information on the most successful product-paywall combinations that you can use in your app, as well as giving several expert insights on what you can do to make your app more profitable in 2023.
Screen 1 1